Task assignment and vehicle routing in a graphic formulation
Formulate task assignment and vehicle routing problem as a path-finding problem in a graph
We aim to answer some critical questions within the context of UAM, such as the requisite number of vehicles to meet daily air travel demands, the optimal approach to the management battery packs in eVTOL aircraft, the impact of battery charging duration on overall profits, the ideal cruise speed of eVTOL aircraft for optimal profitability, the influence of task waiting times, and so on. We want to design a centralized and offline algorithm to address some of these questions.
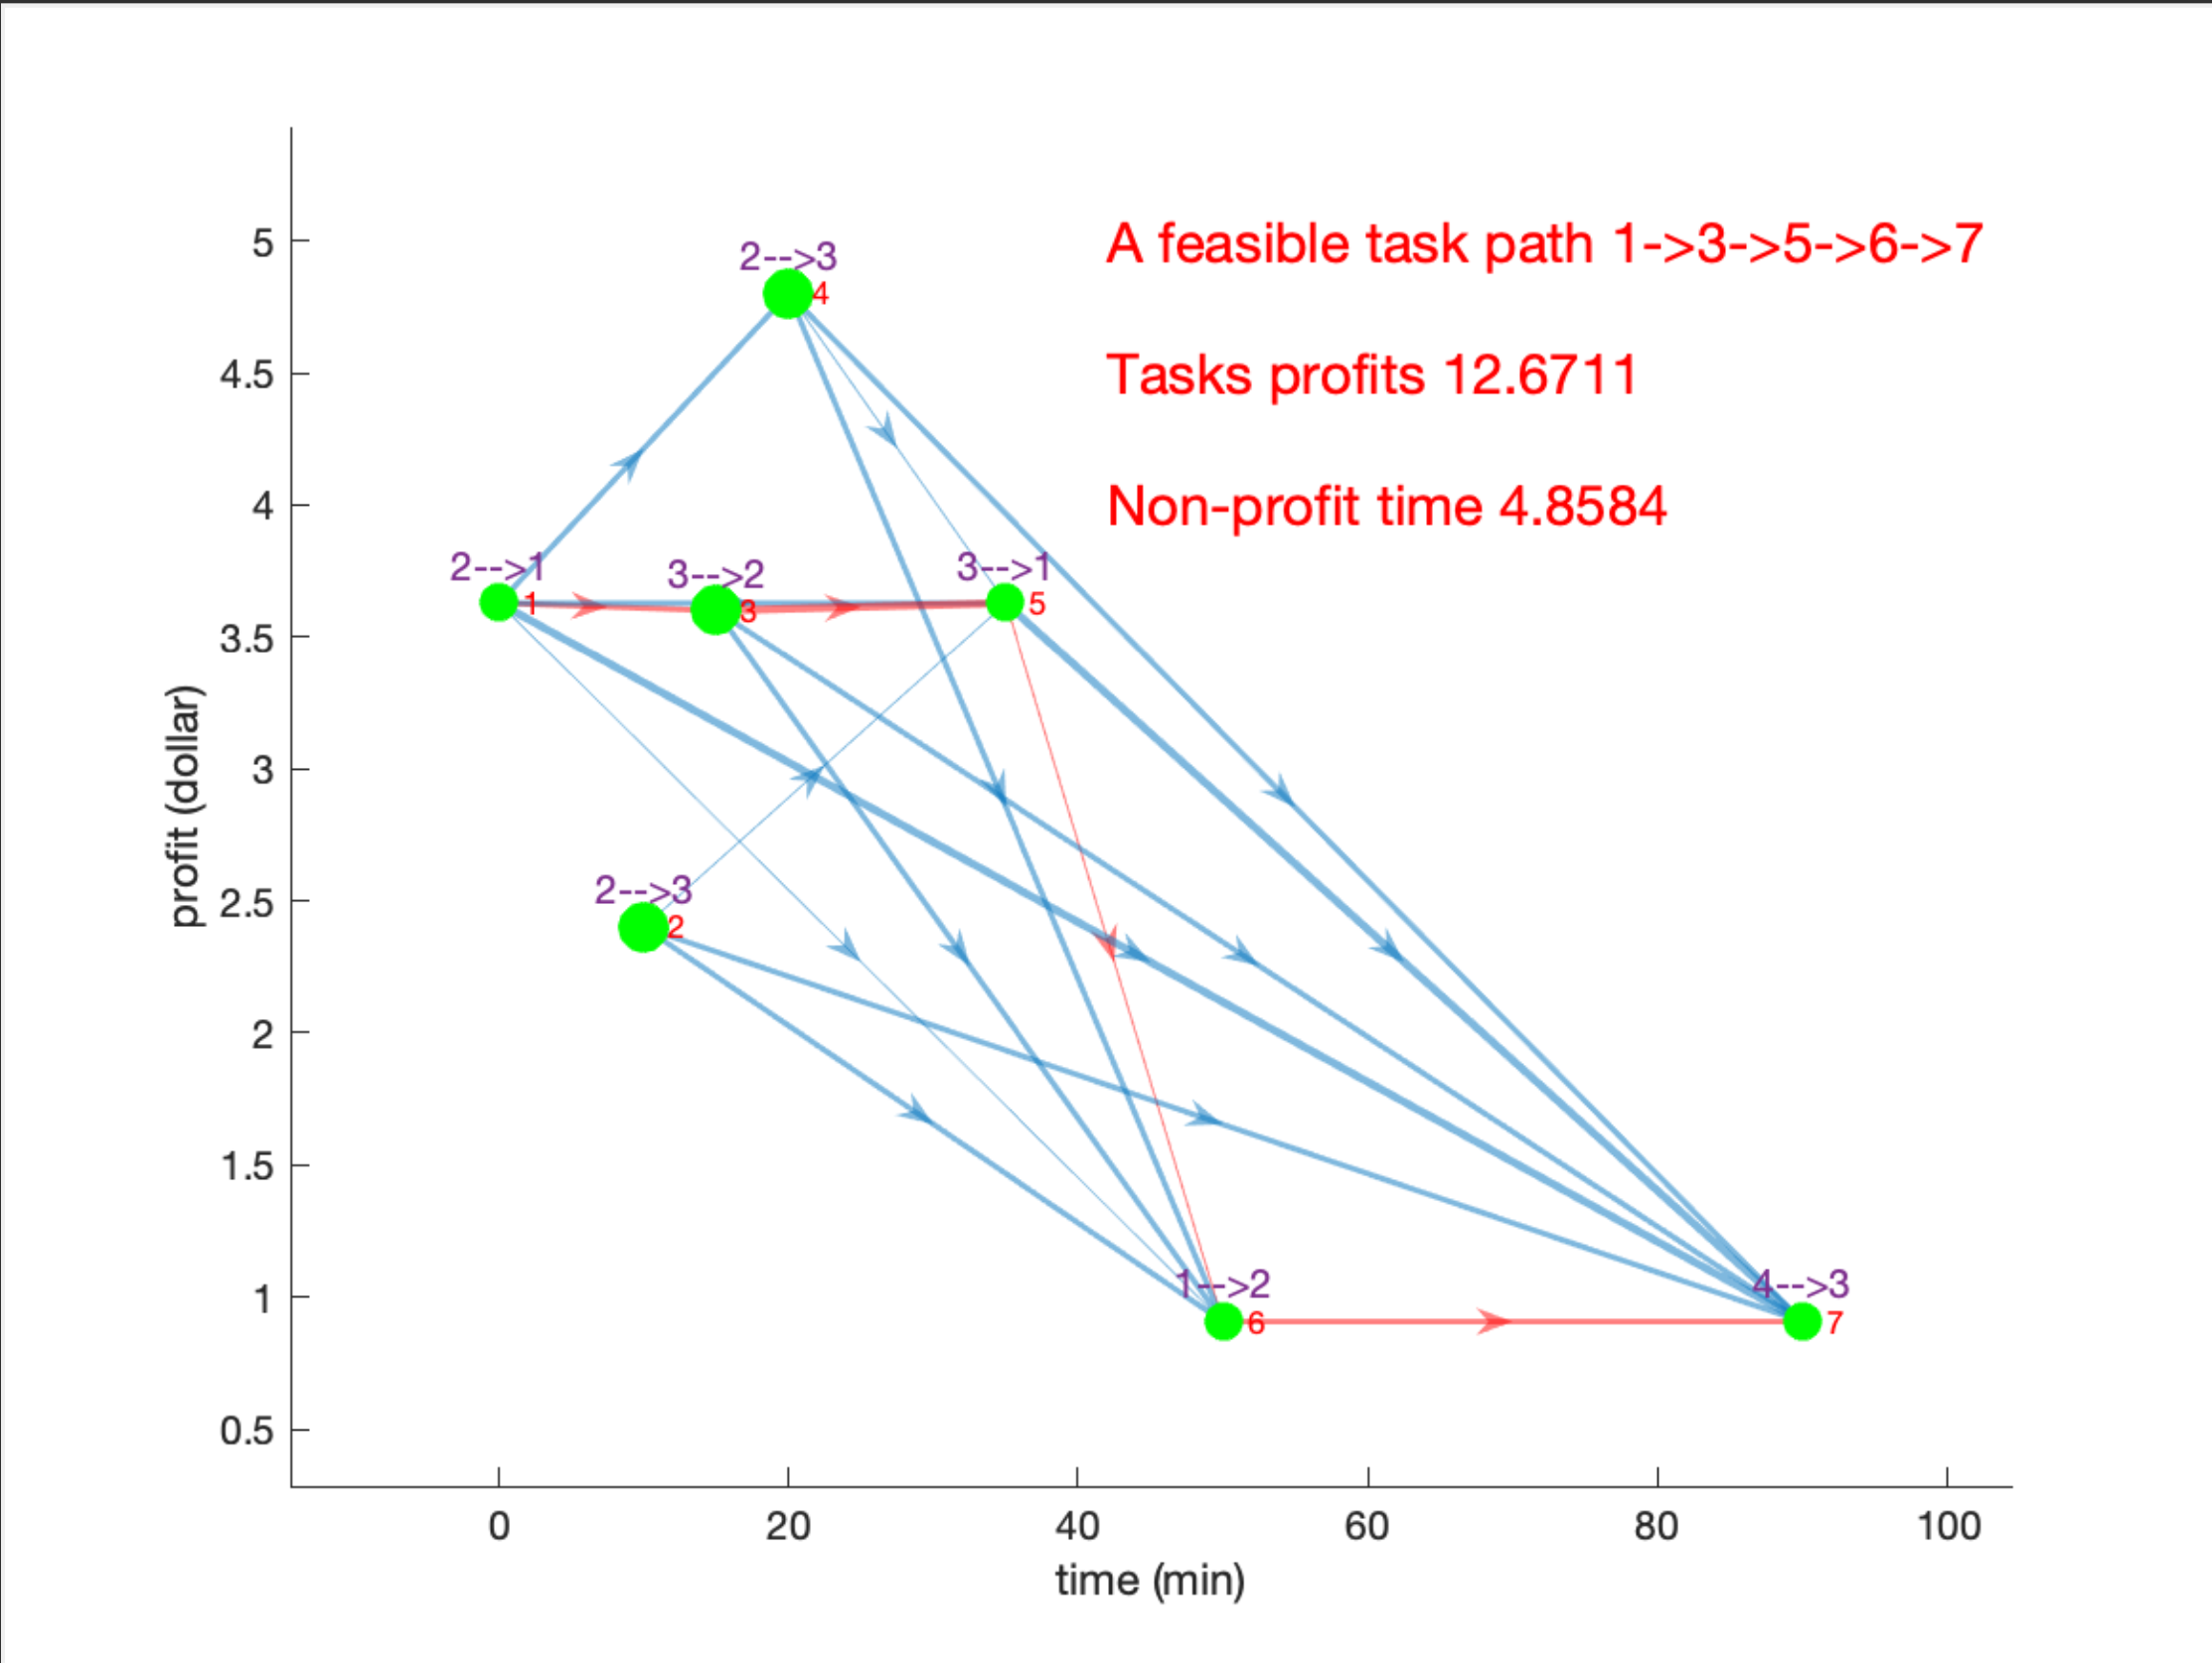
We assign a sequence of tasks to each vehicle within a specified time duration, such as a day, with the purpose of maximizing the overall profits of completing these tasks. We formulate tasks as a directed graph and transform the task assignment problem into identifying multiple non-intersecting paths that maximize the overall profits while satisfying time and battery charge constraints.


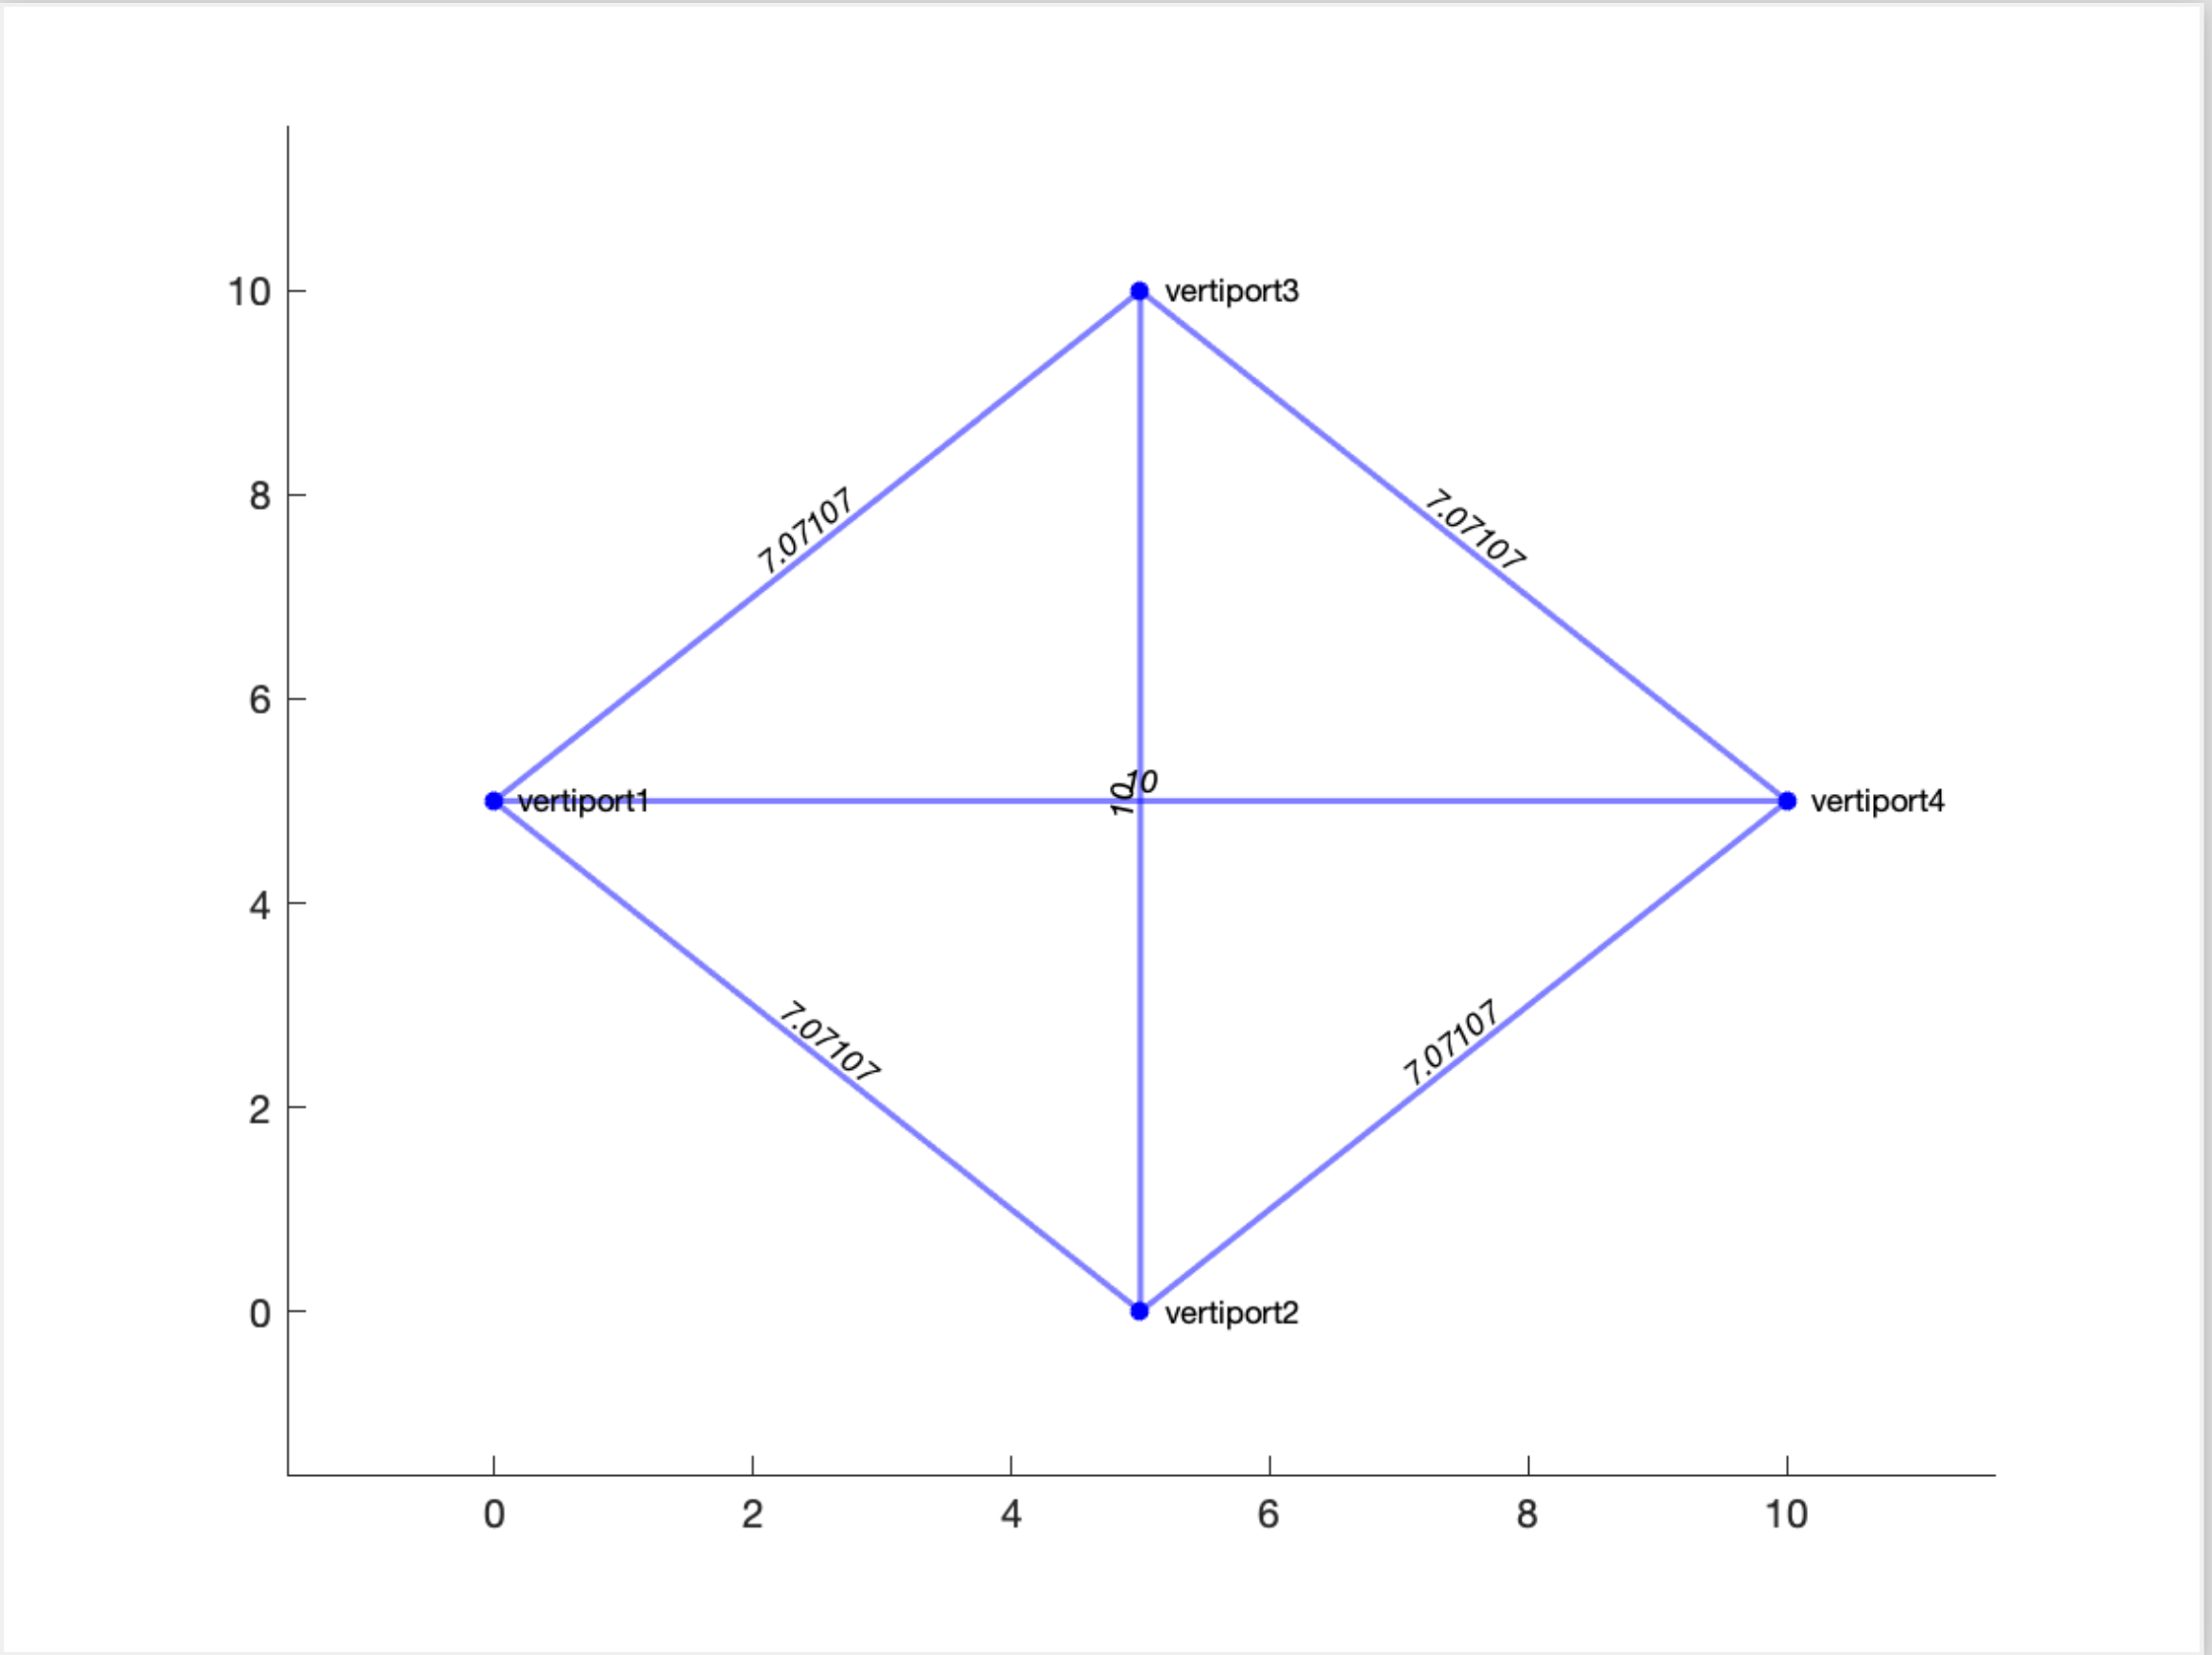
Right figure above presents an illustrative example of a task network consisting of seven tasks. The horizontal axis represents the earliest starting time of each task. For instance, the earliest starting time of task 1 is at t=0, and the earliest starting time of task 7 is at t=90 min. The vertical axis represents the profit associated with each task. For example, task 4 has the highest profit of 4.8. The labels above each node indicate the origin and destination locations of the corresponding task. For example, task 1 is to transfer passengers from vertiport 2 to vertiport 1.
This video shows the animation of vehicle routing as it completes tasks.
Details for this algorithm can be found in my dissertation.